CLICK TO ENLARGE
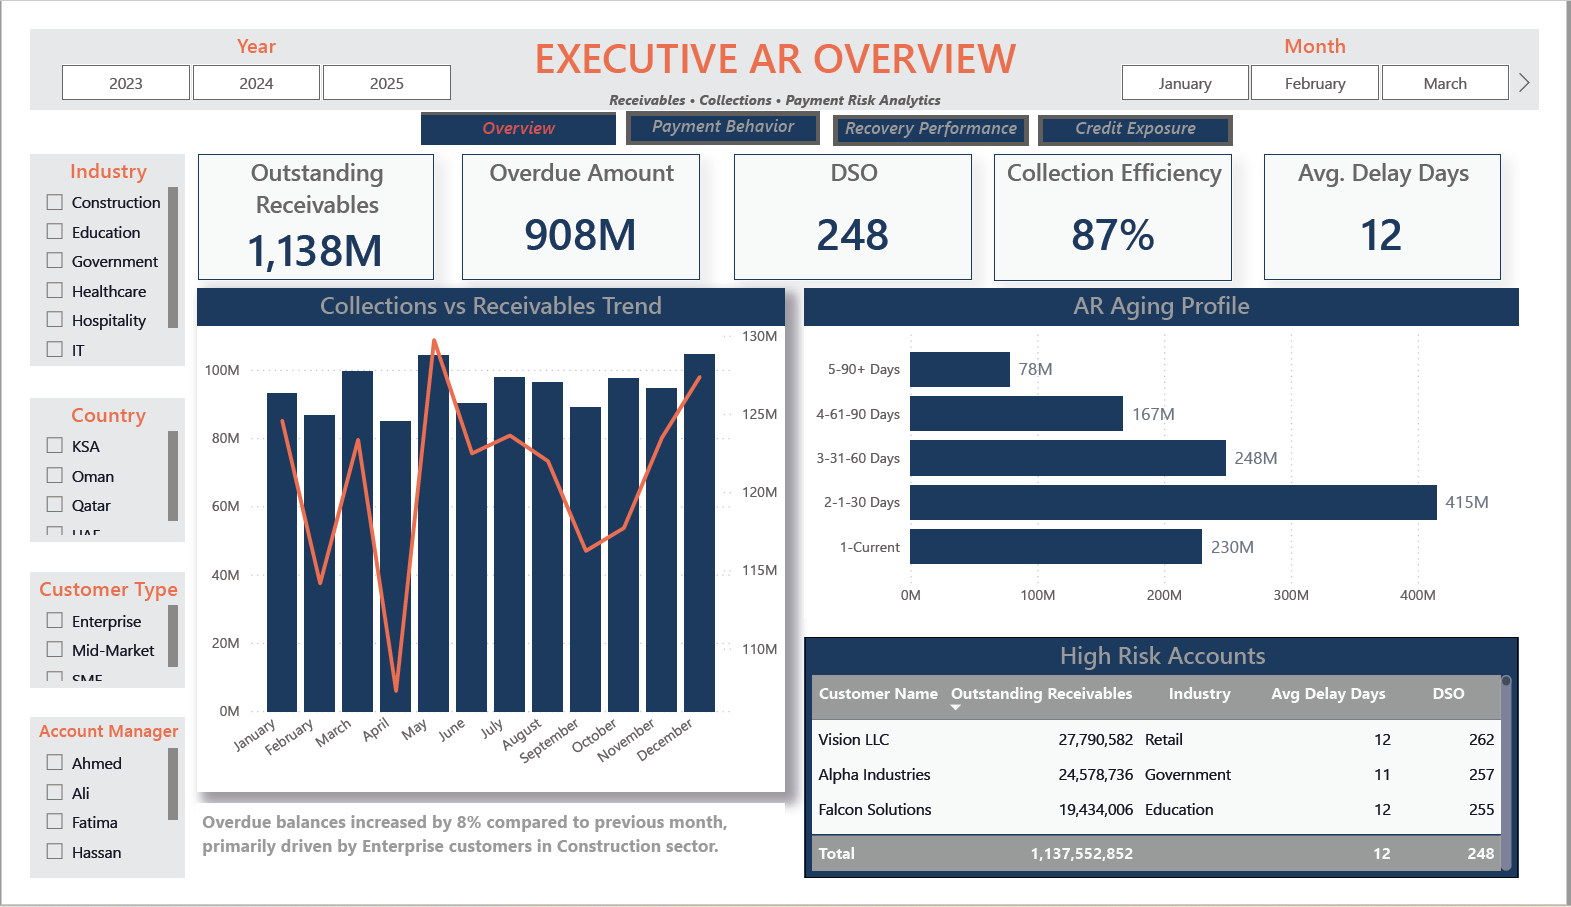
screenshots/executive-overview-dashboard.pngA Power BI analytics solution giving full visibility into receivables, collections, payment behaviour and customer credit risk.
Built with Power BI, DAX and dimensional modeling to demonstrate executive reporting, working-capital analytics and dashboard design.
Working-capital teams track receivables, collections, payment behaviour and credit exposure across customers, industries and account managers — usually in disconnected reports that make the full picture hard to see.
This Power BI project consolidates those into a single analytics framework, so finance leadership can monitor DSO, overdue exposure and recovery performance in one place and act sooner.
Click any dashboard to view it full size.
screenshots/executive-overview-dashboard.png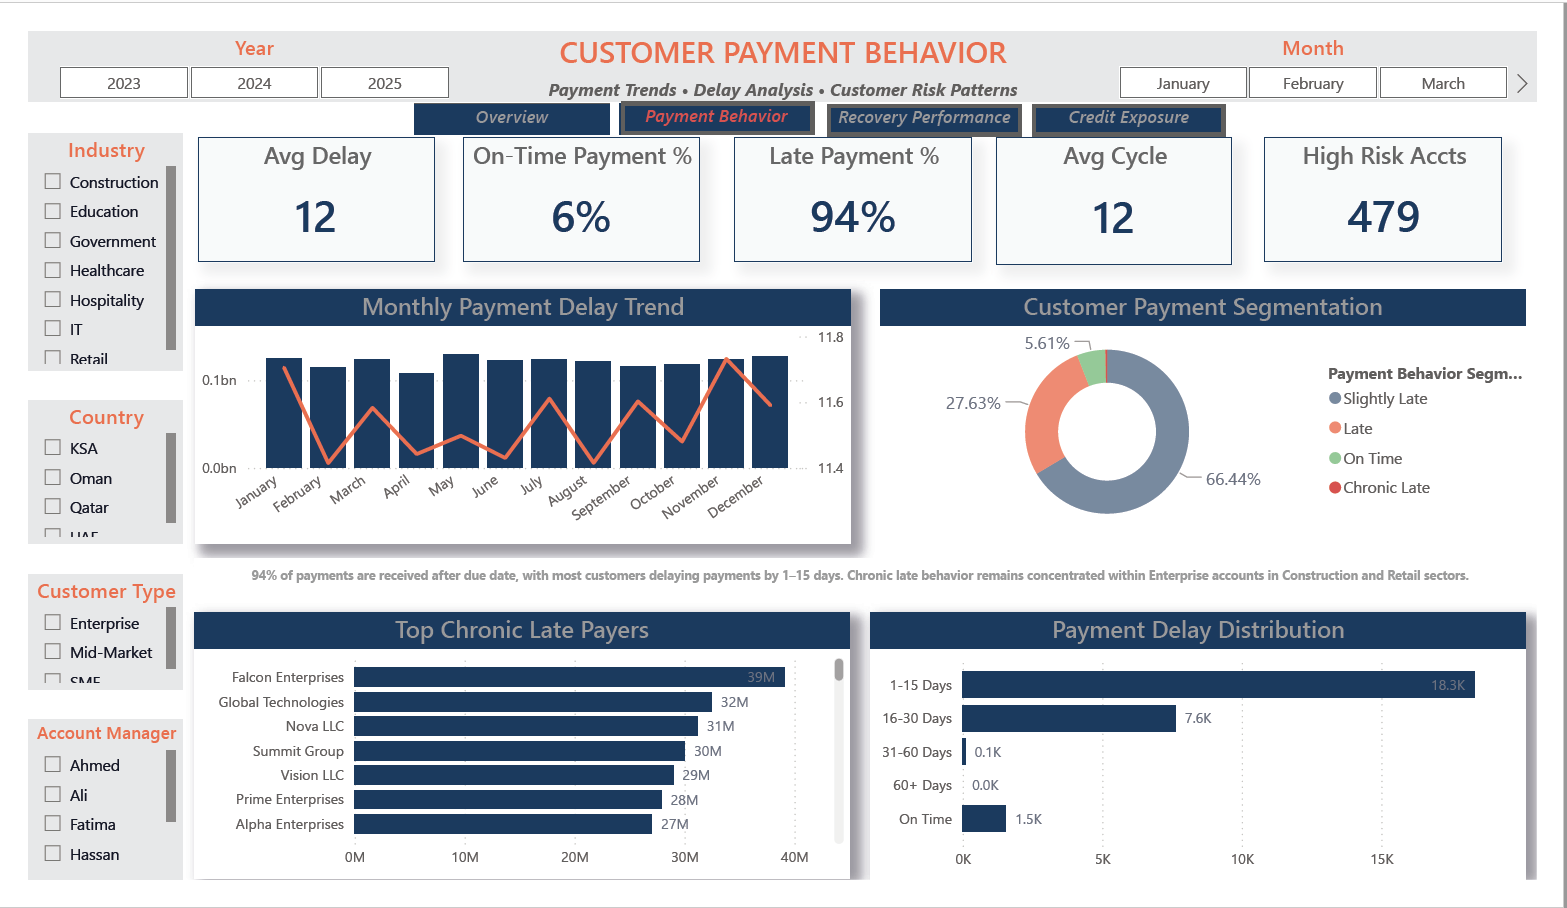
screenshots/aging-analysis-dashboard.png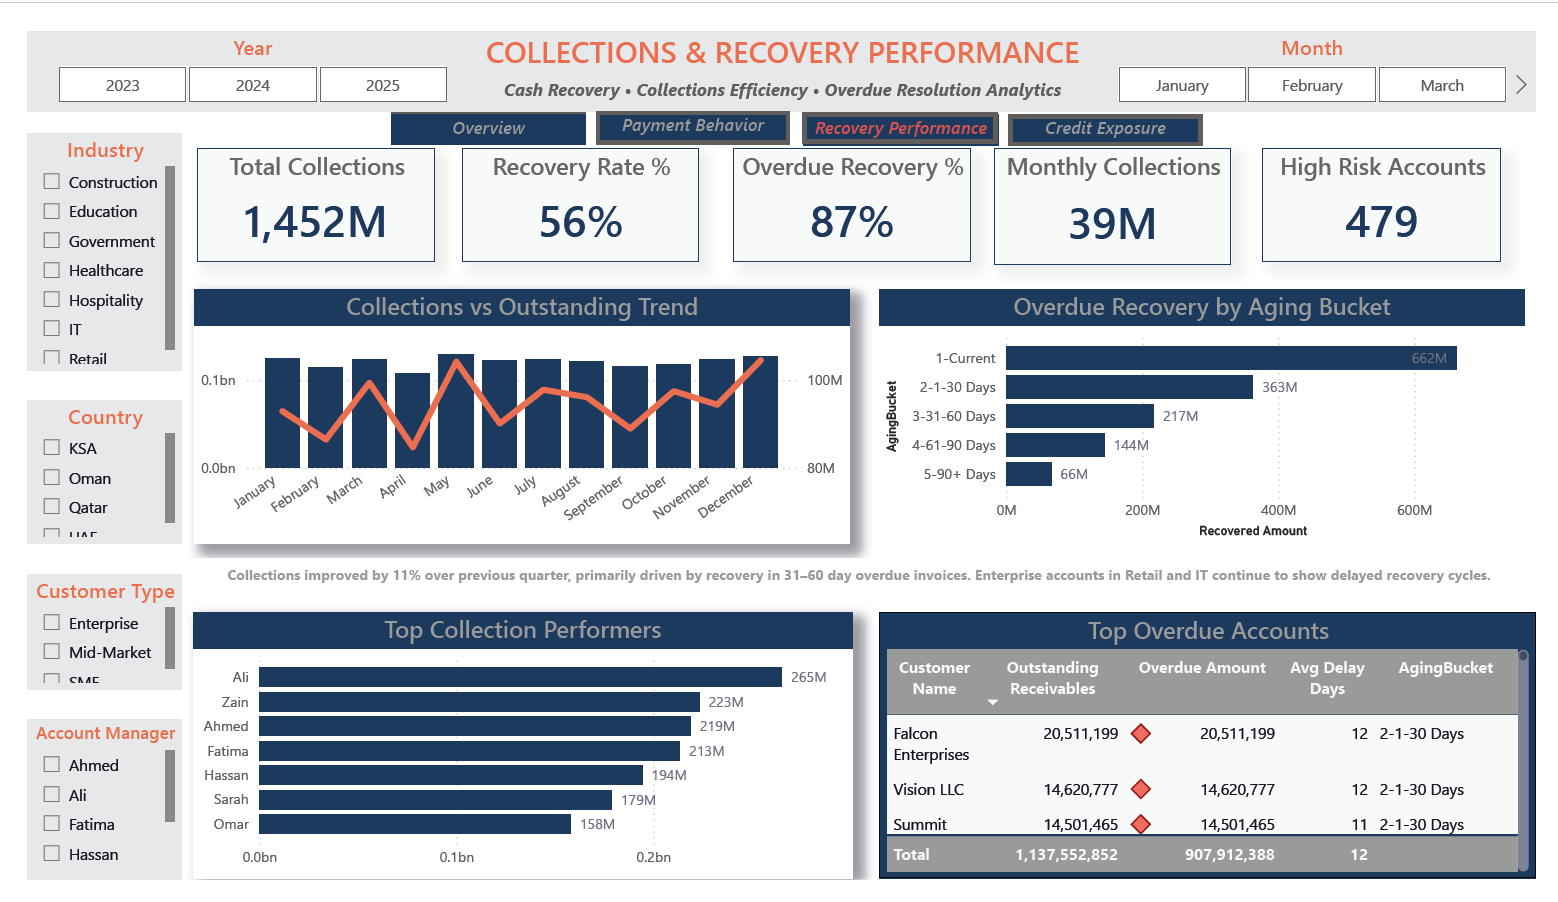
screenshots/collections-performance-dashboard.png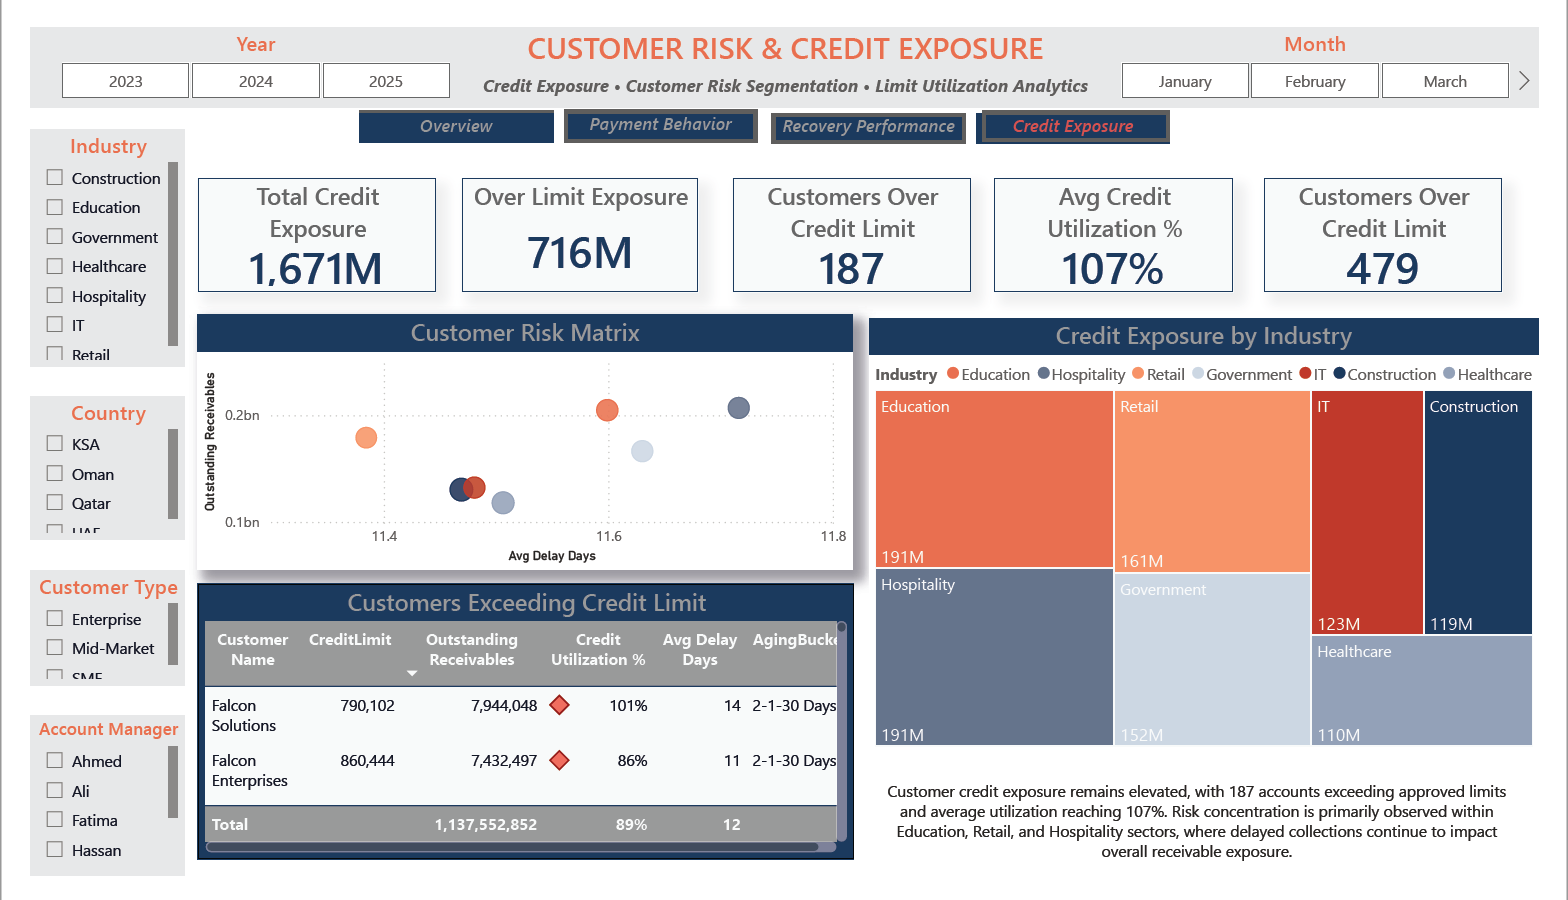
screenshots/customer-risk-dashboard.pngTrack outstanding and overdue balances, DSO and collection efficiency.
Break receivables down by aging bucket and monitor the trend.
Analyze payment timing, delays and chronic late payers.
Monitor cash recovery, recovery rates and top performers.
Track credit exposure, utilization and over-limit accounts.
Centralized KPI monitoring through executive dashboards.