CLICK TO ENLARGE
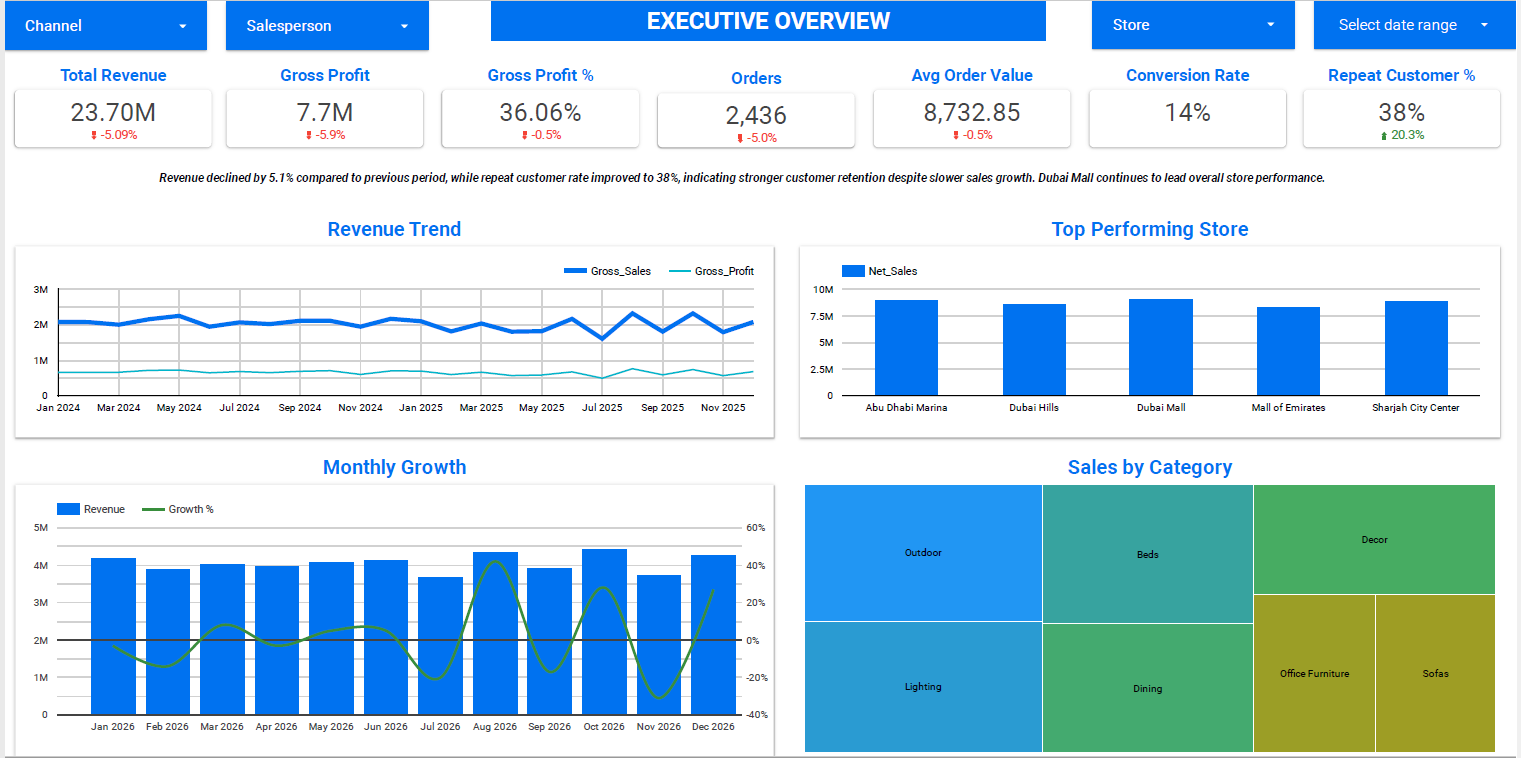
screenshots/executive-overview.pngA Looker Studio analytics solution giving sales, customer and profitability visibility across a multi-store furniture retail business.
Built with Looker Studio, data blending and calculated fields to demonstrate executive reporting, retail analytics and dashboard design.
Multi-store retail businesses generate sales, customer and financial data across stores, channels and salespeople, which makes consolidated reporting slow and inconsistent.
This Looker Studio project brings those views together into a single analytics framework, so leadership can track performance, spot trends and act faster — from one source of truth.
Click any dashboard to view it full size.
screenshots/executive-overview.png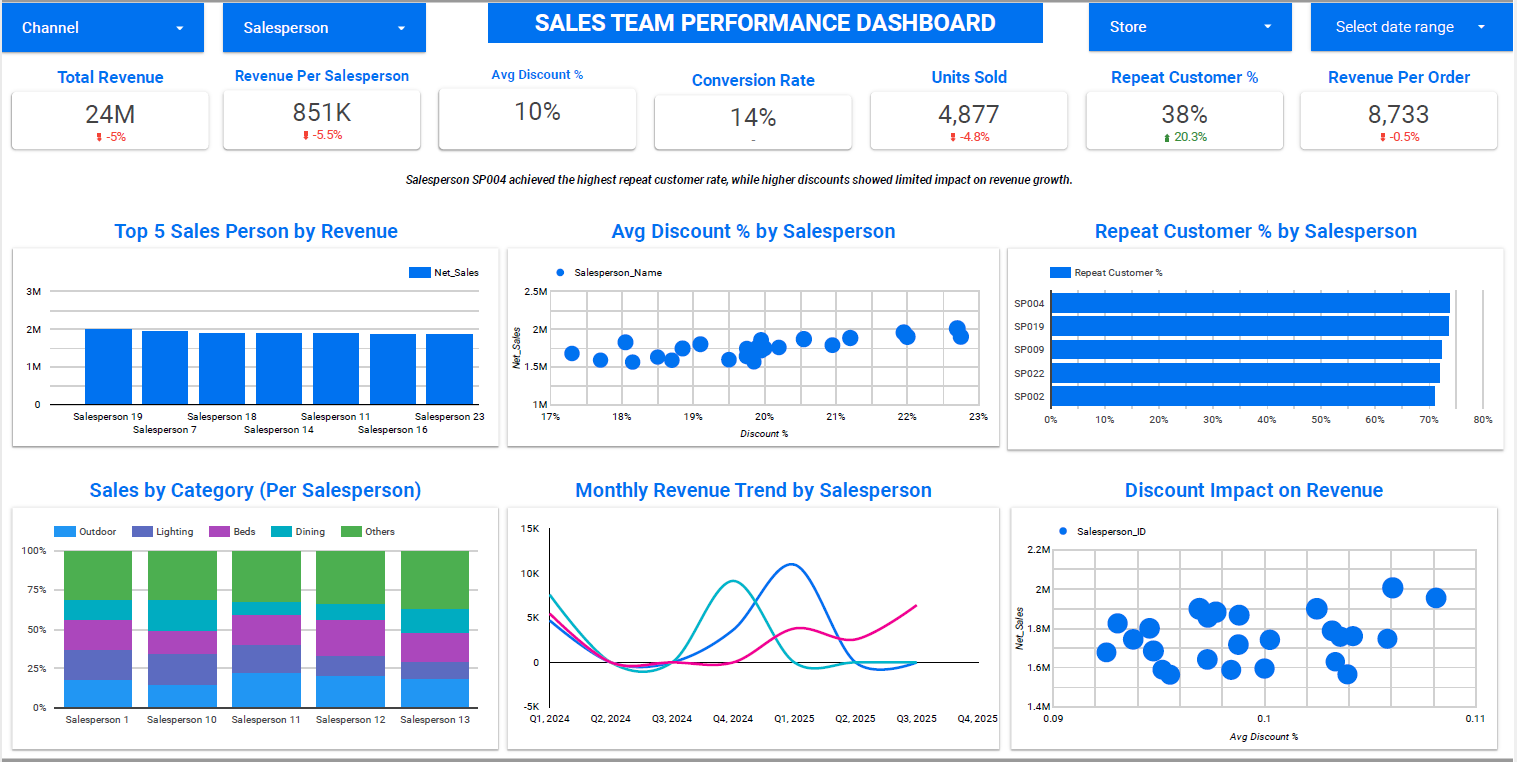
screenshots/sales-performance.png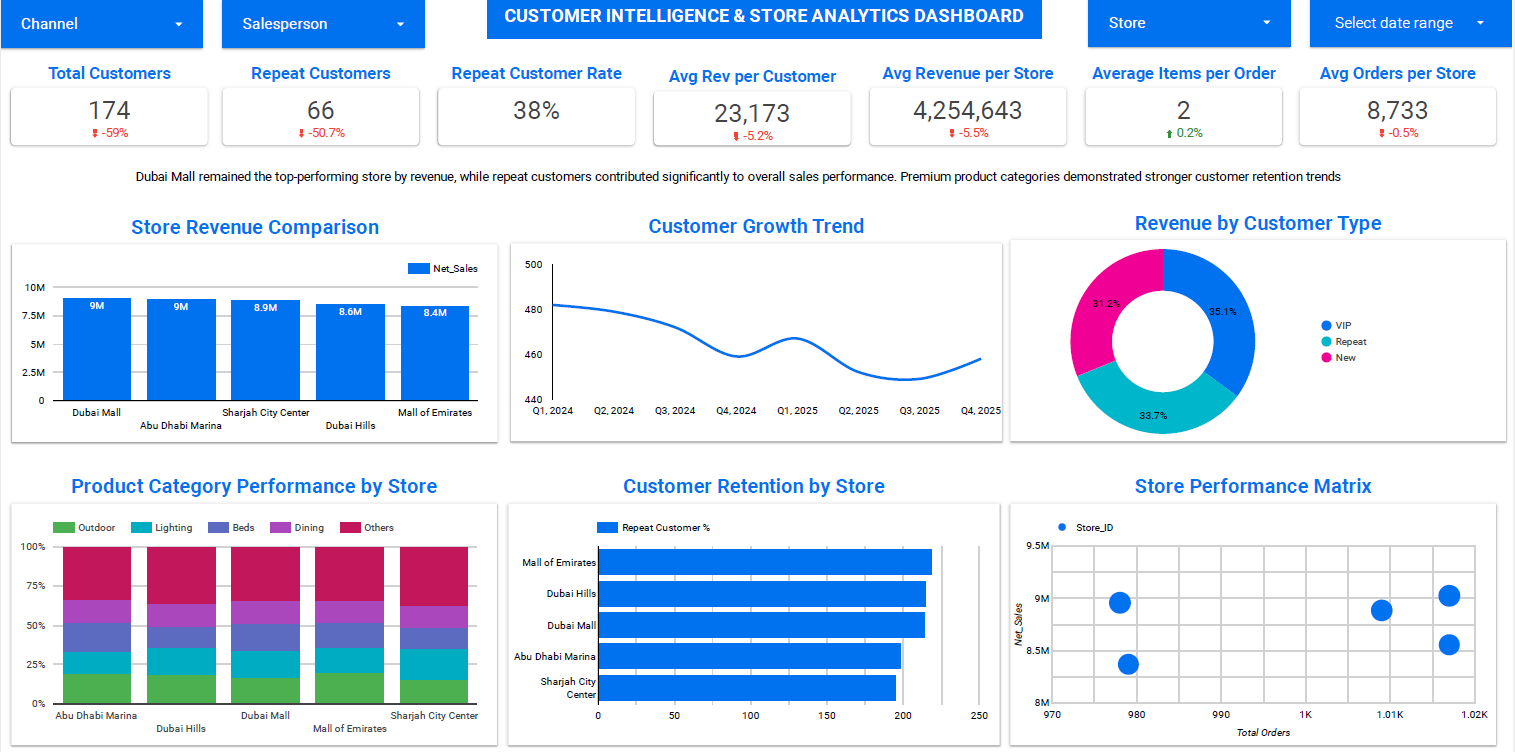
screenshots/customer-analytics.png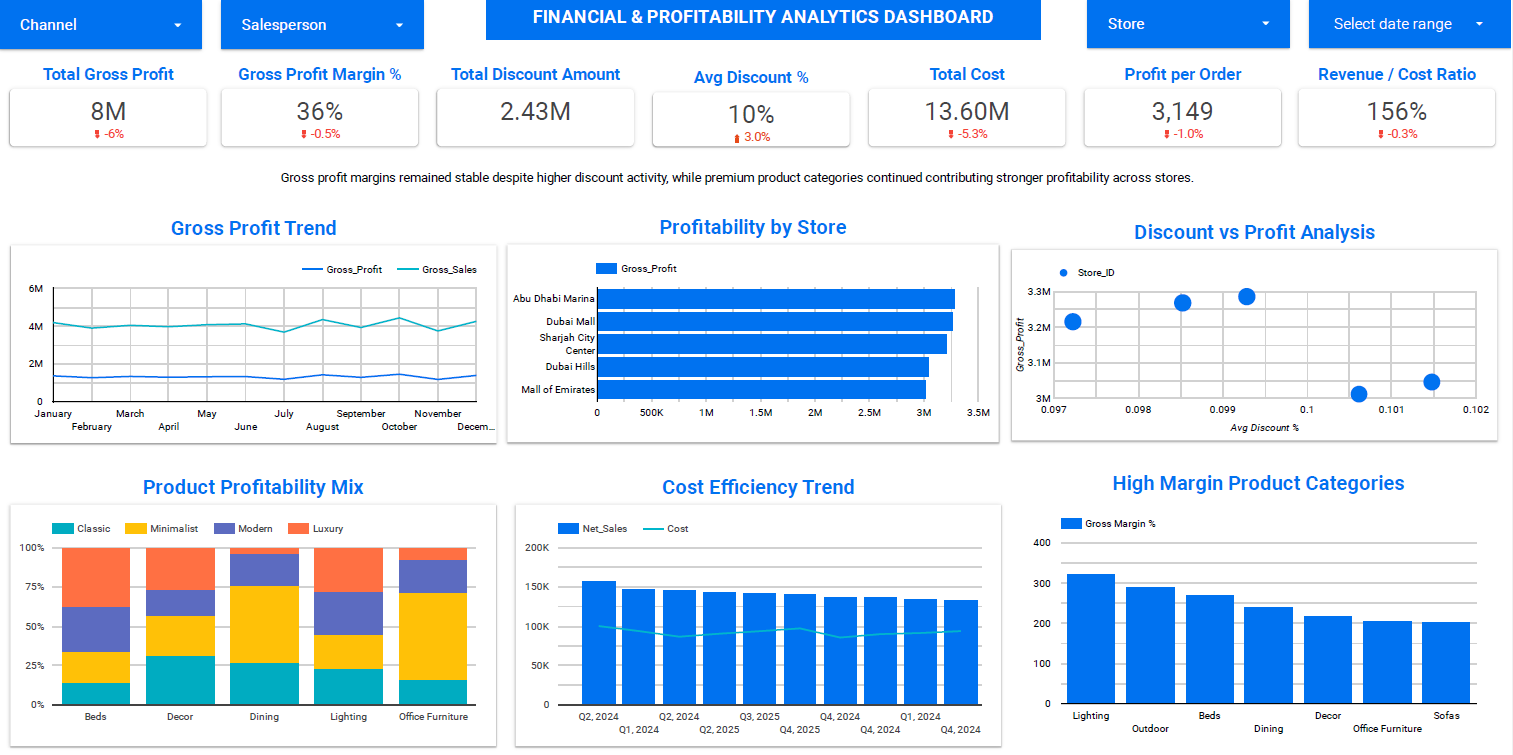
screenshots/profitability-dashboard.pngTrack revenue, units sold, conversion and order value across the team.
Compare performance across stores and sales channels.
Segment customers into VIP, repeat and new, and track retention.
Review margins, costs and discount impact by product and store.
Rank representatives by revenue, discounting and repeat rate.
Centralized KPI monitoring through executive dashboards.